
Fertilizer Availability Percentages in the CNA
In the last issue of The Growers Solution, we looked at the "what" and "why" of the Cost and Nutritional Analysis (CNA). In this issue, we are going to delve into how we determined the various availability percentages used in the Availability Index section of the CNA, as this is probably the most frequently asked question regarding it.
There are two studies we drew this information from. The first is the Michigan State study we often refer to that used radioactive isotopes to track different foliar and soil applied nutrients to determine their absorption and ease of movement through plant tissue They found that phosphorus was easily absorbed and moved throughout the entire plant through the foliage, but that only ten percent of any given nutrient was absorbed through the roots. This study has only a minor influence over the availability percentages as it is not specific to type of products and only broadly relevant in application method. The study that supports most of the percentages is called High Quality Plant Food Advantages: Evaluation of Crop Nutrients. This paper was a joint effort by four people at four different universities (L.M. Walsh, University of Wisconsin; R.L Donahue, Kansas State University; J.O. Veatch, Michigan State University; and H.H. Johnson, University of Minnesota). The study sought to determine how much of different types of fertilizers realized equal crop response 45 days after seed drop.
The availability percentages in the CNA are not explicit in the paper, but rather were gathered by sort of "reverse engineering" the results of the medium fertility table (shown in Table 1) to learn the method the authors used to determine their results. The availability is set for phosphorus (P₂O), but since phosphorus is the main vehicle of nutrient absorption, we assume the same for potassium (K,O) and nitrogen (N). For understanding sake, the "low," medium," and "high" fertility tables are referring to native soil fertility. The method we used to determine the specific availability percentages is as follows:
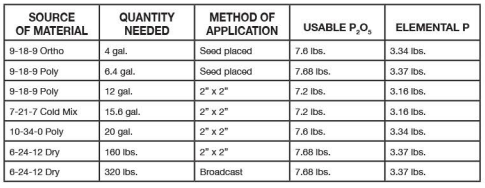
Table 1: The Medium Fertility Table from High Quality Plant Food Advantages: Evaluation of Crop Nutrients. At its base, it shows how much of each type of fertility product is needed to realize the equal crop response talked about above. The column "Usable P,0," is the amount of phosphorus needed for the equal crop response. The column "Elemental P" is not relevant for our purposes as elemental P is usually only used in analysis for animal mineral supplements.
CALCULATING THE AVAILABILITY PERCENTAGES
The calculations used to determine the availability of percentages for the seven products listed in the Medium Fertility Level table had to be done before we could calculate the percentages for any products not listed in the original table. We will explain why this is later on. The formulae used to calculate the original seven products is described in Tables 2 and 3, using the 9-18-9 ortho and the 6-24-12 broadcast respectively as examples.
Table 2: The steps to calculating the availability percentages of the 9-18-9 orthophosphate product listed in Table 1. These steps are the same for any of the liquid fertilizers present in Table 1.
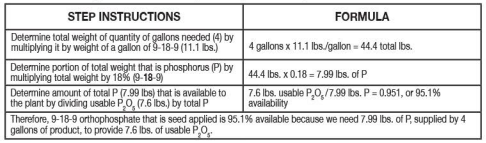
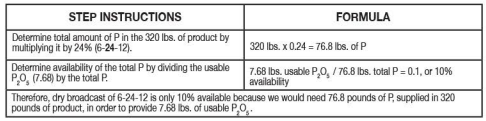
Table 3: The steps to calculating the availability percentages of the 6-24-12 dry broadcast product listed in Table 1. These steps are the same for this product whether it is applied via broadcast or 2х2.
If you've perused the CNA, you will have noticed that there are more than seven products listed in the Fertilizer Availability Index table. These percentages were arrived at by isolating specific variables that affect availability, including mix type, placement, and ortho- vs. polyphosphate to determine how much each variable effects product efficiency. This is done by comparing two products that only differ in one variable to determine how much of a difference that variable makes, and then applying that difference to a product not on the original table. Table 5 shows how to determine the availability percentage of a cold mix, ortho seed applied liquid (which is not on the original table). Since we know the availability of a hot mix, ortho seed applied liquid product, we need only determine how much of a difference hot vs. cold mix makes.
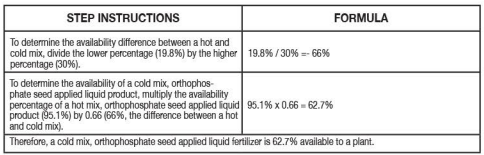
Table 5: The steps to calculating the availability percentages of product types not listed in Table 1, using a cold mix, polyphosphate product that is applied 2x2 (19.8% available) and a hot mix polyphosphate product that is applied 2x2 (30% available) to isolate the difference hot vs. cold mix makes. The steps are the same for any product not included in Table 1, only changing the variables associated with the different products you are using.
This method can be used to determine the availability percentage of any number of different kinds of products, as long as they share the hot/cold, ortho/poly, and application method variables. For products/ methods that do not share these variables precisely, such as the bottom several products on the Fertilizer Availability Index of the CNA, the same principles that govern the availabilities of other variables still apply, meaning that educated guesses were made.
Note: For many liquid fertilizer products, it may be difficult to determine whether they are hot or cold mix, and what kind of phosphorus is used (ortho or poly). Most companies will claim their product is hot mixed and mostly orthophosphate. If you're unsure, look at the price: If it is cheap, it is likely neither hot mixed nor mostly orthophosphate as hot mix is an expensive process and orthophosphate and expensive raw material.
This is an excerpt from the Late Fall Growers Solution (2021), written by Zach Smith, Product and Training Specialist.
Signup for our newsletter to stay in the loop